Maps on Rails
In a recent project we needed a map. Not just any map though. We needed to be able to add topo and satellite layers, add feature overlays from json feeds of both points and shapes and define zoom and center points.
We looked into a variety of solutions, including mapbox and google-maps. These are great solutions with their own benefits but for our requirements we chose Leaflet.js.
Leaflet is the leading open-source JavaScript library for mobile-friendly interactive maps. Weighing just about 38 KB of JS, it has all the mapping features most developers ever need.
Leaflet is a flexible, opensource solution. It is JavaScript based, with css styling - so is a familiar environment for web developers.
The core Leaflet.js focuses on doing the basics perfectly - but it still has a lot of functionality. There are also many useful plugins and an open API if you need to extend it further.
Getting Started
You Can include the JS via the leaflet-rails Gem.
# Gemfile
gem 'leaflet-rails'
Then add Leaflet to the application.css and application.js files
// application.css
= require leaflet

// application.js
= require leaflet
Configure the default settings for your maps in leaflet.rb initialiser.
Leaflet.tile_layer = "https://{s}.tile.openstreetmap.org/{z}/{x}/{y}.png"
Leaflet.attribution = "Your attribution statement"
Leaflet.max_zoom = 18
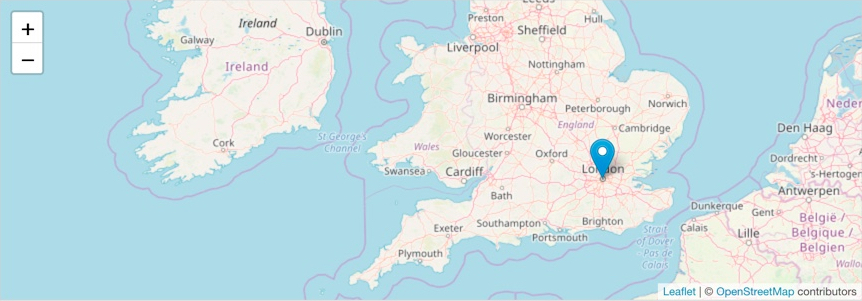
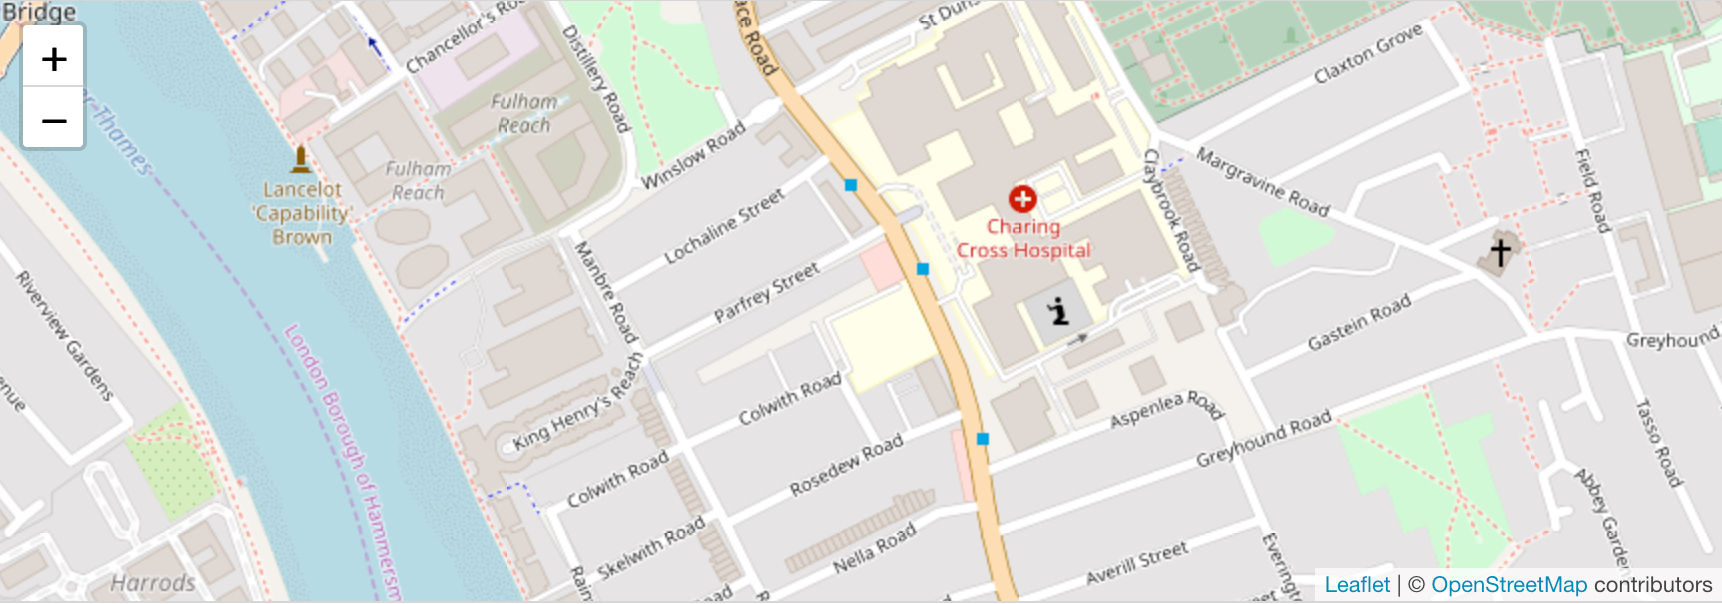
And now display the map on your page with the helper.
<%= map(:center => {
  :latlng => [51.52238797921441, -0.08366235665359283],
  :zoom => 18
}) %>
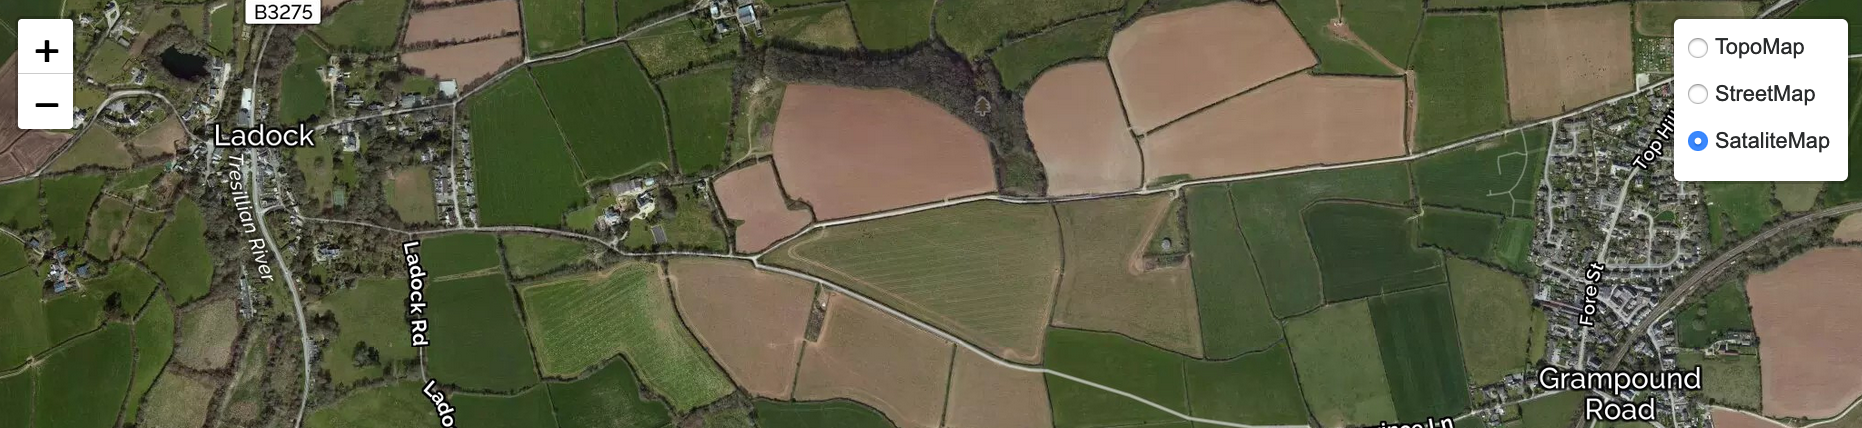
Adding Layers
You can add multiple layers to your maps. For example, you might want more than one BaseLayer. BaseLayers are the source map tiles. So if you want for example Street maps, Topo Maps and Satalite Maps, with a toggle to choose which layer to display you can add that.
var topo_map = L.tileLayer('http://{s}.tile.opentopomap.org/{z}/{x}/{y}.png', {maxZoom: 17, attribution: 'Map data: OpenStreetMap'});
var street_map = L.tileLayer('http://{s}.tile.openstreetmap.org/{z}/{x}/{y}.png', {maxZoom: 19, attribution: '© OpenStreetMap'});
var satalite_map = L.tileLayer('http://{s}.tile.your_satalite_map.org/{z}/{x}/{y}.png', {maxZoom: 19,   attribution: '© SataliteMapOrg'});
var baseLayers = {
  "TopoMap": topo_map,
  'StreetMap': street_map,
  'Satalite': satalite_map
};
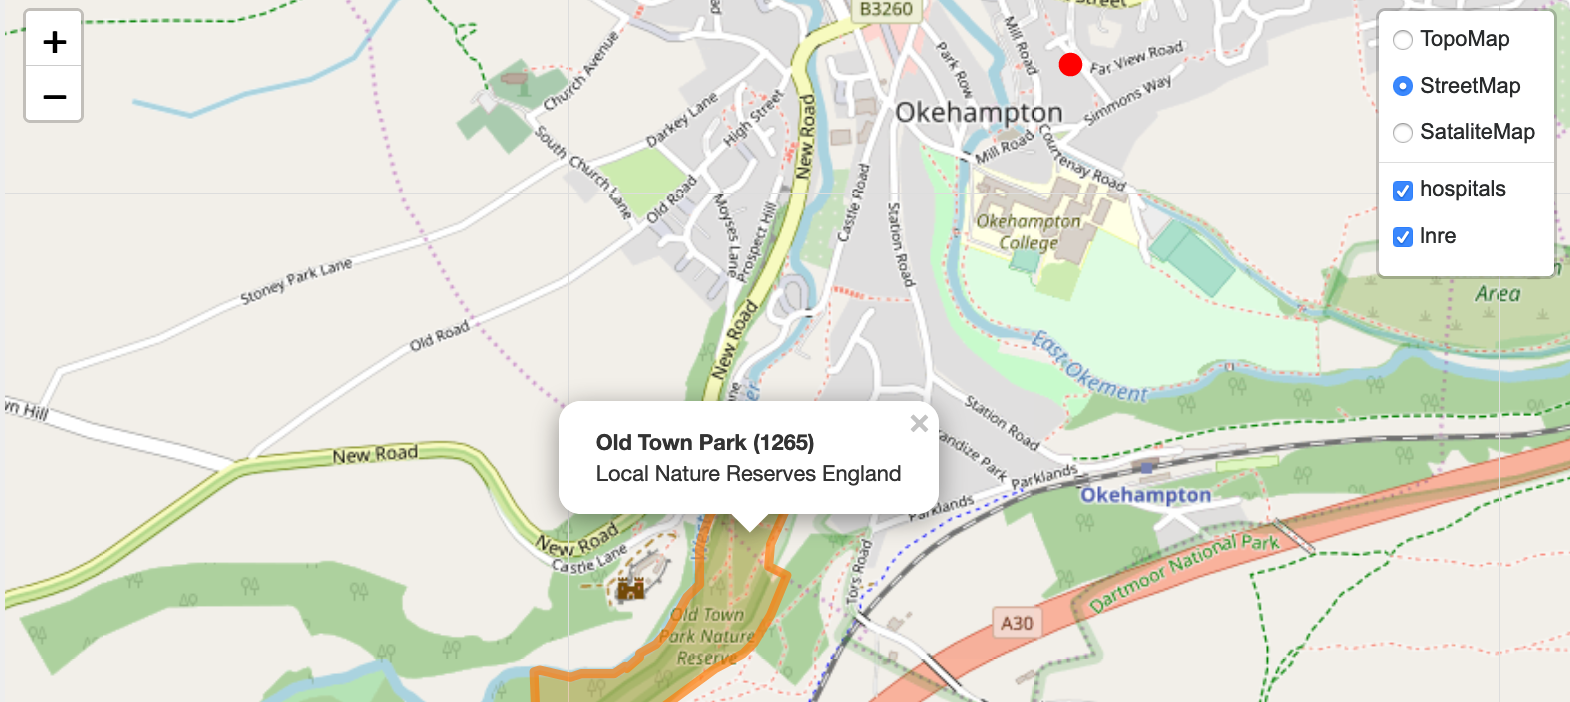
Adding Markers
Adding Lines, points, areas and Icons as layers of data overlayed on your map is fairly straightforward. Expose the data as json from your own app, and then include it as overlays on the map.
var lnre = new L.GeoJSON.AJAX("/lnres.json, {"color": "#ff7800", "weight": 5, "opacity": 0.65, onEachFeature:popUp});
var hospitals_style = {color:'red', fillColor:'red', radius: 6, apacity: 1.0, fillOpacity: 1.0, weight: 1, clickable: true};
// addTo(map) shows the layer on page load.
var hospitals = new L.GeoJSON.AJAX("/hospitals.json", { onEachFeature:popUp, pointToLayer: function (feature, latlng) {return L.circleMarker(latlng, hospitals_style);} }).addTo(map);

var overlayMaps = {
  'hospitals' : hospitals,
  'lnre' : lnre
}
And now show the map
// application.js

var map = L.map('mapid', {
    center: [52, 0],
  zoom: 15,
  layers: [street_map]
});
L.control.layers(baseLayers, overlayMaps).addTo(map);

// map.html.erb
<div id="mapid"></div>
Wrap
And that’s a wrap. We have maps displaying in our web applications. The maps work great on desktop and mobile. We can add lots of baselayers for different views of the terrain. We can add our own data as overlays. Maps are cool.